BUSINESS INTELLIGENCE
REPORTING + VISUAL ANALYTICS
ON-DEMAND VIDEO SERIES

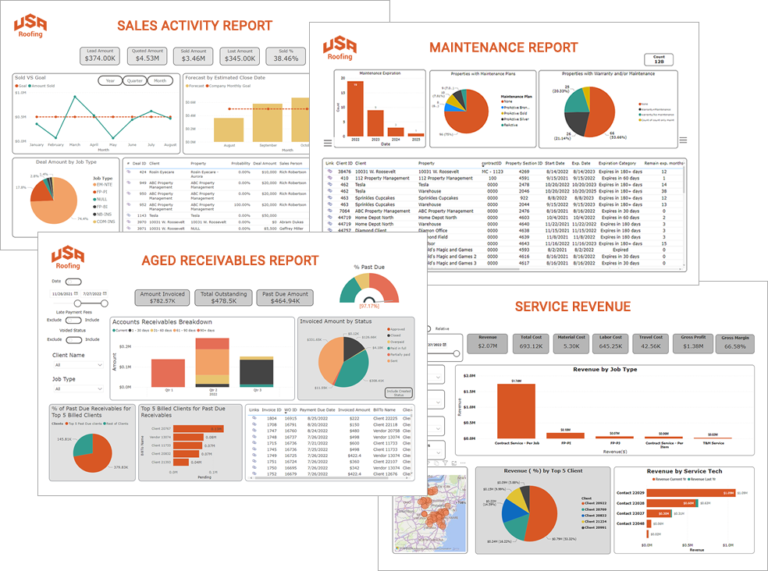
Utilize Jobba’s integrated Microsoft Power BI visual reporting & data analytics tool to make more informed decisions, while assessing your overall business health.
In this quick video series, see how Jobba’s Power BI pre-built reports and comprehensive, color-coded charts and graphics help contractors to visualize data instead of having to sort through and interpret tons of information on a spreadsheet. Learn how you can use business intelligence reporting to easily identify and focus on areas of interest or departments that may need improvement.
ACCESS THE POWER BI VIDEO SERIES NOW →

