BUSINESS INTELLIGENCE
REPORTING + VISUAL ANALYTICS
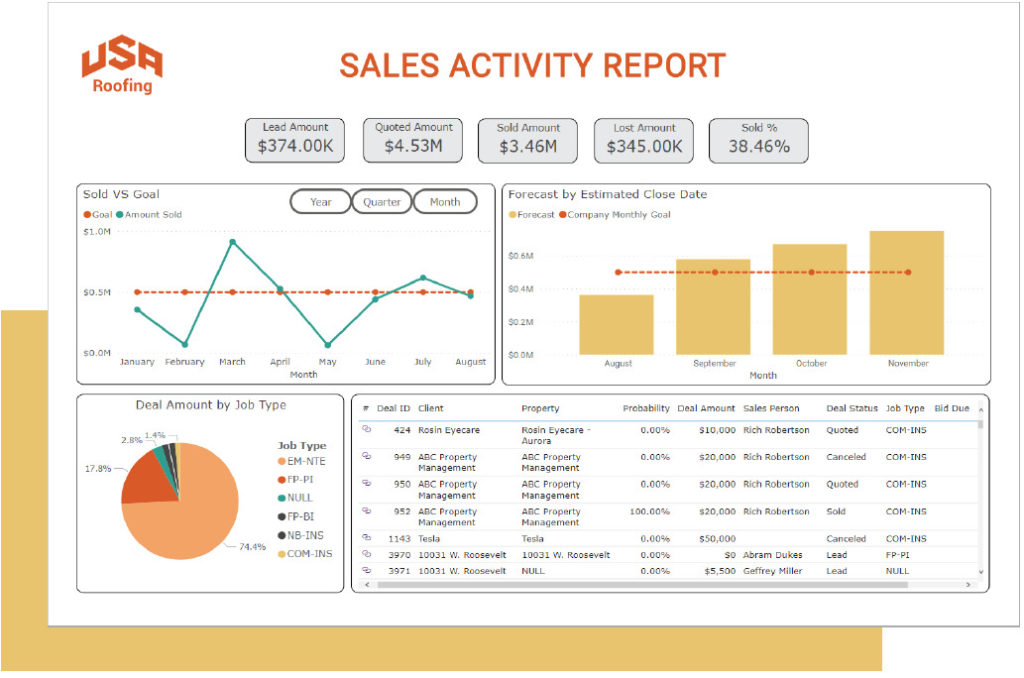
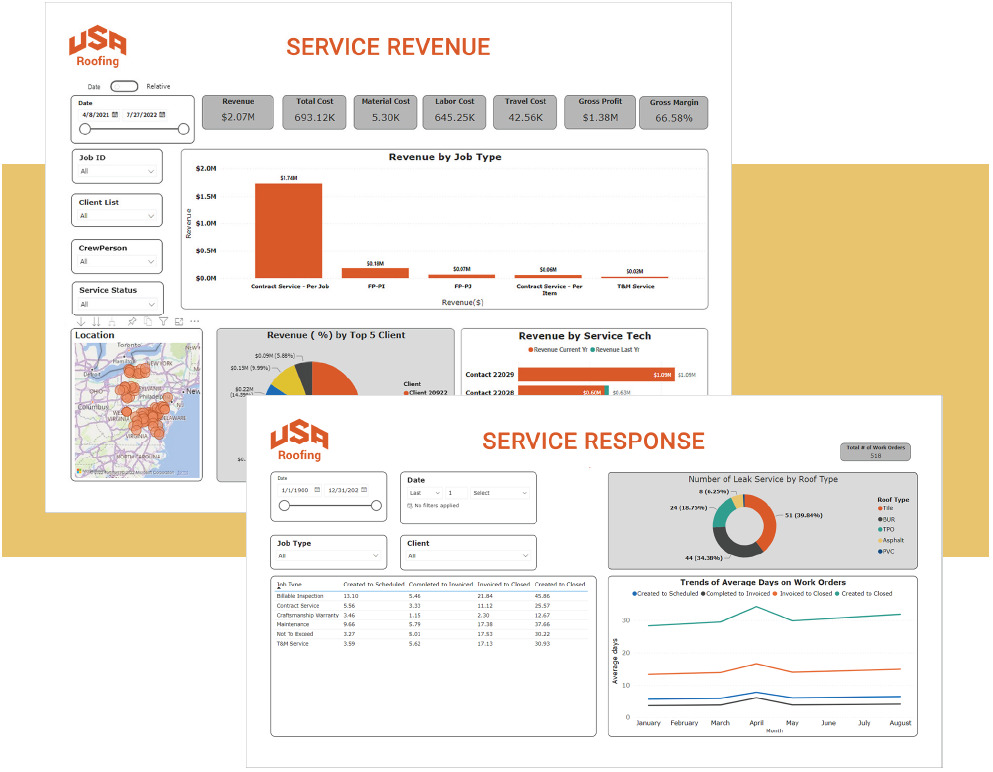
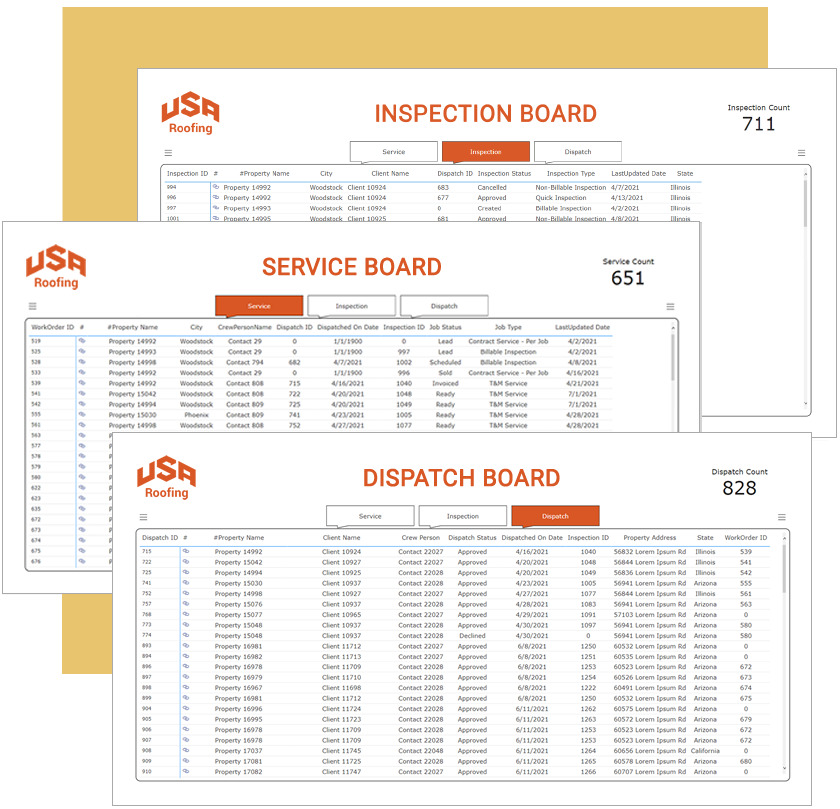
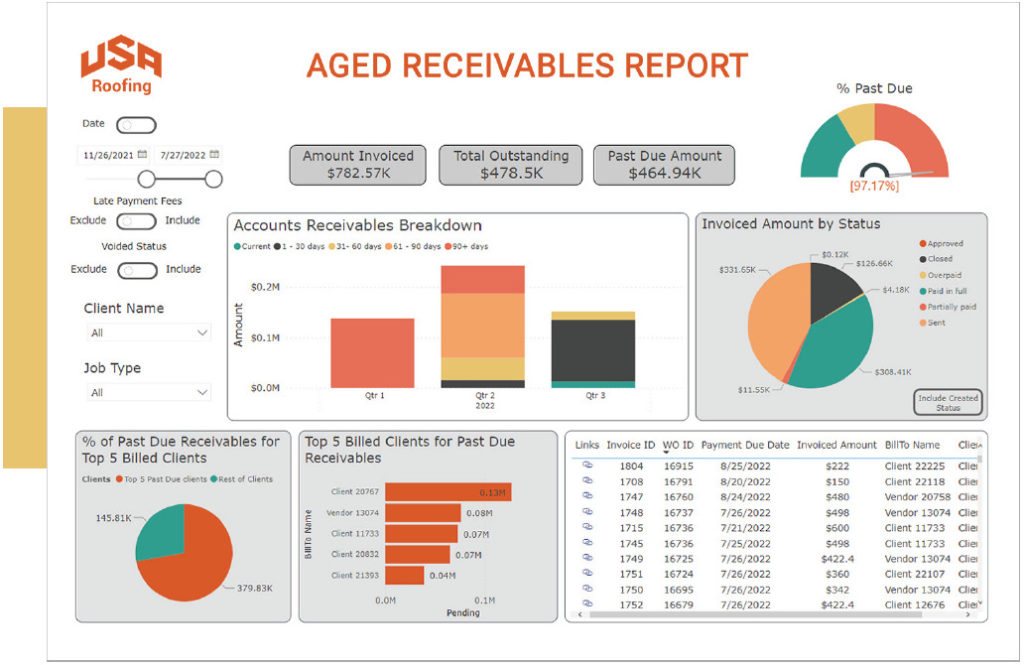
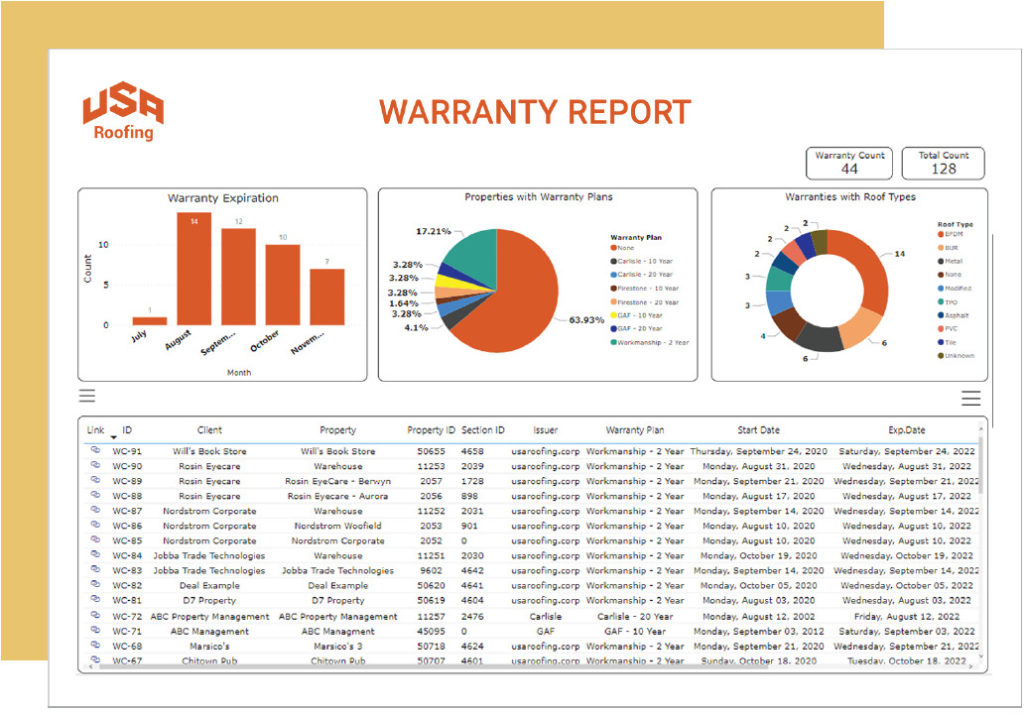
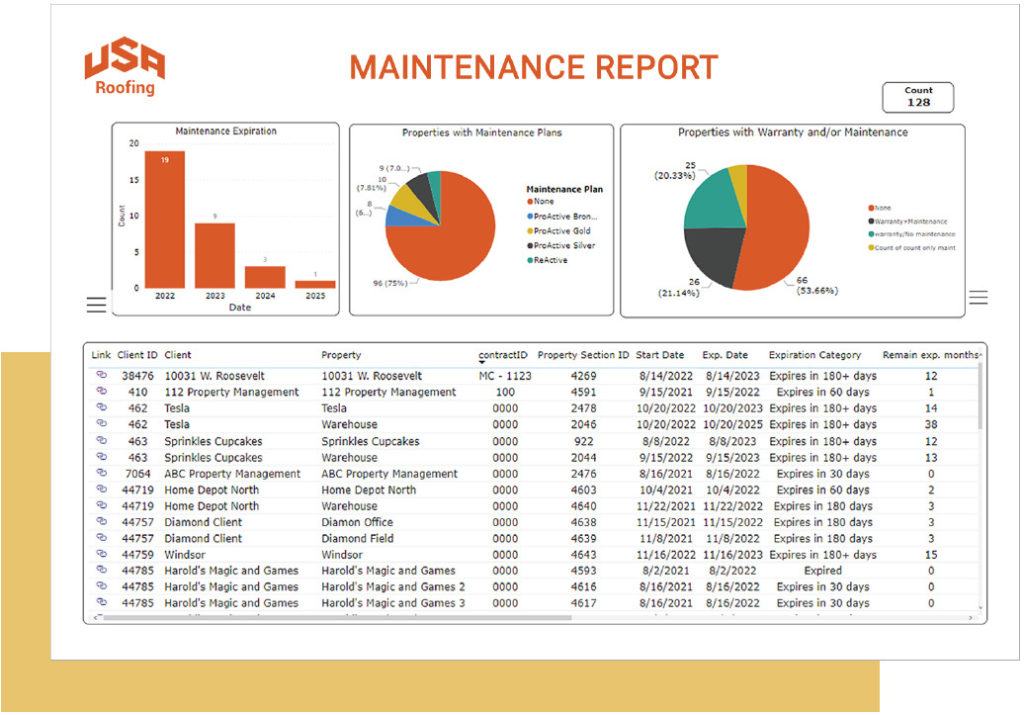
Utilize Jobba’s integrated Microsoft Power BI reporting analytics tool to make more informed decisions, while assessing your overall business health. With Jobba’s Power BI pre-built reports and comprehensive, color-coded charts and graphics, you can visualize your data instead of having to sort through and interpret tons of information on a spreadsheet.
Sales Activity Report
The Sales Activity report provides an overview of deals and opportunities that are in process, according to job type and deal status. Users can see trends by time range and salesperson.
Service Performance Report
The Service Performance report comprises two dashboards: Service Revenue and Service Response. Service Revenue provides a view of the available job types and the revenue those job types drive. Service Response provides performance indicators tied to the completion of service work by job type, client list, and more.
Service Detail Report
The Service Detail report comprises three dashboards: Inspection Board, Service Board, and Dispatch Board. These dashboards contain more detailed information related to inspections, service jobs, and dispatches and can be filtered by client, property, and status.
Aged Receivables Report
The Aged Receivables report shows the state of invoices across customers with the opportunity to split by customer name or job type. Users can click a link and be taken into the Jobba platform to view invoice and client information.